77GHz mm Radar SM validity verify and Proven in use analysis
This week we can discuss the proven in use in Chapter8 of ISO 26262-2018, and yet what to be seen is few Tier-1 had correct methodology to perform the safety mechanisms validity verification inproductions, operation, maintenance or decommisionning phase, also to perform the proven in use analysis when using field data, and that is why this articlebeing assisted in better solutions, especially for 77GHz mmRadar, more of the contexts based on the last article: https://www.linkedin.com/pulse/pmhf-improvement-77ghz-mmradar-samuel-weng/.
1. Safety Mechanisms validity verification inproductions, operation, maintenance or decommisionning phase
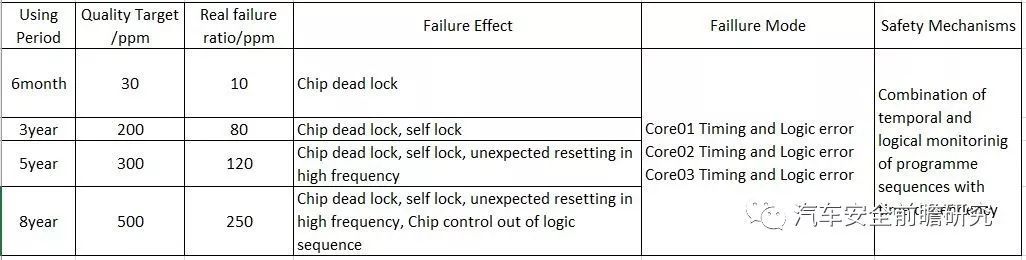
In last article: https://www.linkedin.com/pulse/pmhf-improvement-77ghz-mmradar-samuel-weng/, we had formulated one potential SYS architecture, but suppose this chip hadused in one project called PRJ_01 in Tier01, and it had got mass production,annual production and selling XXXXXXX quantities and put into use over 8 years,quality requirements had listed as following:
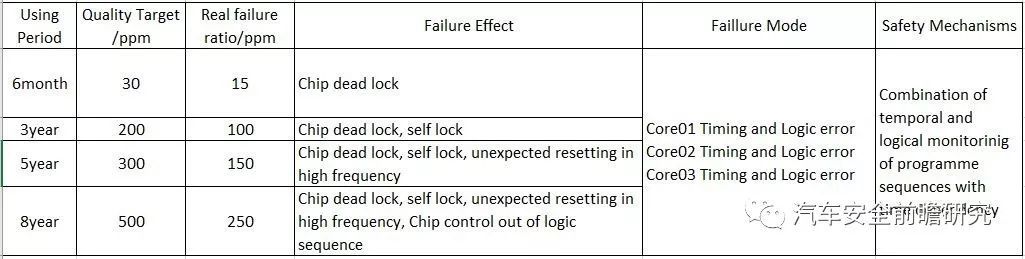
(1) 30 ppm in beginning 6 months
(2) 200 ppm in 3 years
(3) 300 ppm in 5 years
(4) 500 ppm in 8 years
All of the above quality requirements and quantitativeindex all can be met. And the detail failure status and detail failure modes listedas Table01:
Table01: Detail failure status statistics
Let's go back to article in'https://www.linkedin.com/pulse/pmhf-improvement-77ghz-mmradar-samuel-weng/' the Table4, we can get following safety design conclusions in PRJ_01 in Tier01:
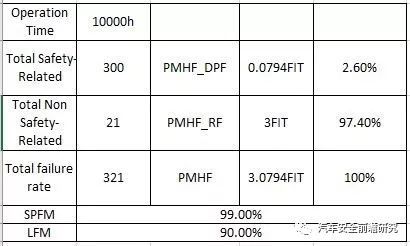
PMHFest=3.0794FIT
All the information above about this infineon chipdesign and real mass productions we can see very in detail, and here we have two kinds of topics:
(1) Safety Mechanisms validity verify:
As we can see from 'https://www.linkedin.com/pulse/pmhf-improvement-77ghz-mmradar-samuel-weng/' the Table4, PMHF had been calculated, which highlighted random hardware failures potential violation Safety Goal failure rates.
And from bath-tub curves listed in FIG01, it follows the weibull distribution formulas as FIG02,
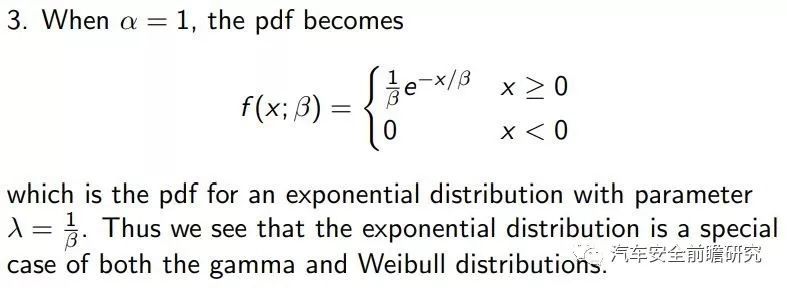
Note: because most of the vehicle life>10 year, wesuppose 8 years is within the second period--horizonal period: beta=1, and atthat time, the weibull distribution formulas come into being into FIG03, it isthe exponential distributions.
FIG01: Bathtub curve(beta is shape parameter)
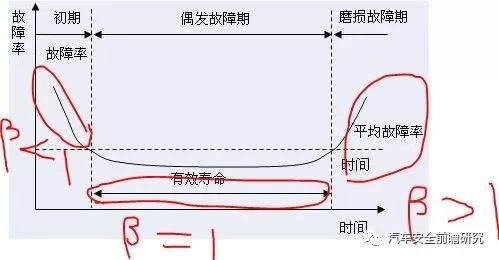
FIG02: Weibull formula(alfa is shape parameter)
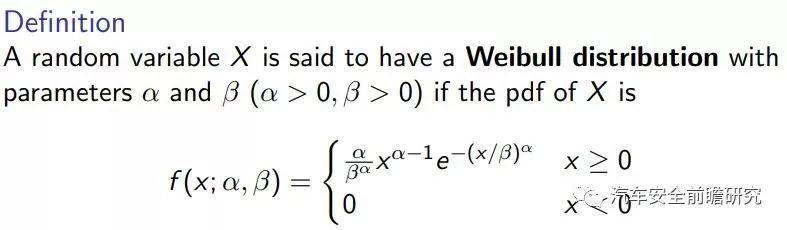
FIG03: Shape parameter=1
So, here for detail Table01 failure distributions, it follow exponential distributions, the failure rate calculation formula follow FIG04:
FIG04: Exponential Distributions
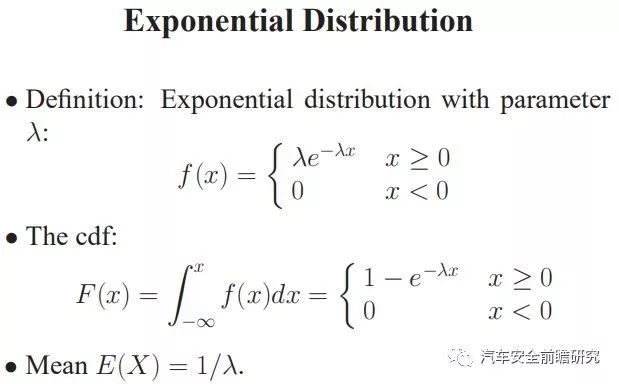
From Table01 and FIG04, we have following prerequisites:
(1) 77 mm Radar will be used 24h a day;
(2) Infineon chips operation time=life time'
And we can derived out following equations:
(1)F(x)=250ppm
(2)x=operation time=life time=8*365*24=70080h
(3)lamda=3.5678FIT
Here we get the safety design failure ratelamda=3.5678FIT higher than PMHFest value 3.0794FIT, which might be caused by two reasons:
(1) systematic failures too high, leading to too highreal mass production matched failure mode failure rates higher than safetydesigned
(2) our original assumptions of 8 years in the beta=1 is a fault, 8 years is in beta>1, that means the higher failure rate causedby aging and wearing.
Following above process, we can also calculate:
(1)lamda(5year)=3.4249FIT >PMHFest
(2)lamda(3year)=3.805FIT >PMHFest
So, the 3year, 5year, 8year all are not meeting thePMHFest value, we can conclude it is the systematic failures too high failurerate so that leading to all of the 3year, 5year, 8year higher than PMHFest.
And systematic failures originates from:
(1)design failures
(2)manufacturing and operation failures
(3)quality management failures<----not so in highprobabilities, because the real failure rate is lower than target qualityfailure rate from Table01
(4)etc
After many tries, Tier01 had found it is themanufacturing failures leading to too higher random hardware failure ratehigher than the PMHFest value, and they try their best to improve themanufacturing process, then the final failure rate after infineon chips hadmass production comes from:
Table02 Improved failure status statistics
Note: one investigation of consumer's operation behavior forecasts that in 3years, almost 0.3FIT more failures coming from consumer's misuse or abuse operations. After they reduce their non-rational behaviour, those 0.3FIT can be deduced.
And we calculate the failure rate lamda, to compare with PMHFest, conclusion comes:
(1) lamda(8year)=3.5678FIT >PMHFest
***if having better user operation manuels, thefailure rate can be downsized into lam(3year, better manual)=2.744FIT
It means: 5years and 3years are in the beta=1 zones,8years are in the beta>1 zones, and our safety mechanisms validity seemsgood even in the production, operation, maintenance, decommissioning phase.
Note: If the manufacturing process or others had beenmodified into state of art state, and also the lamda of 3year, 5year, 8year higher than PMHFest, we have to feedback to safety mechanisms design and todiscuss if the safety mechanisms are invalid actually, and find way to improve.
(二)Proven in use analysis
When Tier01 had modified their manufacturing process,and ensure their safety mechanisms sufficient in the real product production,operations. Tier02 autonomous driving supplier want to using this 77mmRadar in PRJ_02,and also infineon chip to reduce development cost.
At Tier02 had to perform the proven in use analysisfirst.
(1) Tier01 77mmRadar background:
Based on https://www.linkedin.com/pulse/pmhf-improvement-77ghz-mmradar-samuel-weng/ , we can see the 77mm Radar can accomplished the ASIL D PMHF requirement. And they have quite a lot field data as shown in Table02.
(2) Tier02 Proven in use analysis:
①In PRJ_02, the 77mm Radar also intended to perform ASILD, and almost same operation situations, contexts, and just small physical change compared to PRJ_01 in Tier01.
②Field data analysis performed:
we have following 3 potential methods to analysis fromISO 26262-2018, Chapter8:
FIG05: Limits for observable incident rate(TABLE6 inISO26262)
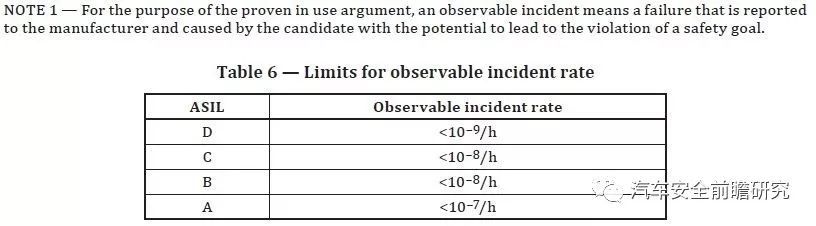
FIG06: Targets for minimum evaluation period ofcandidate(Table7 in ISO26262)
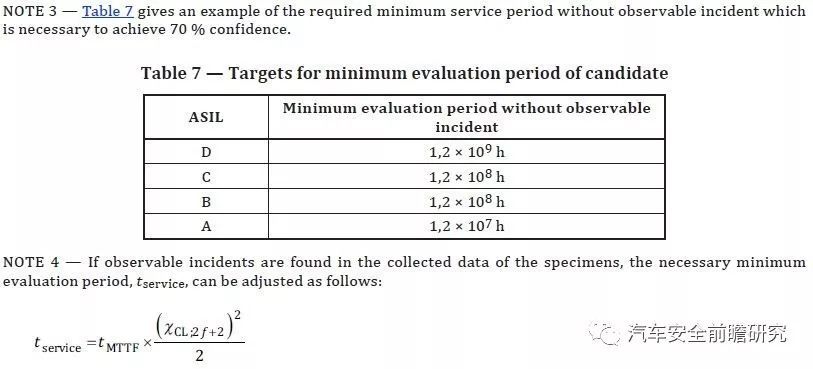
FIG07: Limits for observable incident rate (interimperiod)(table8 in ISO26262)
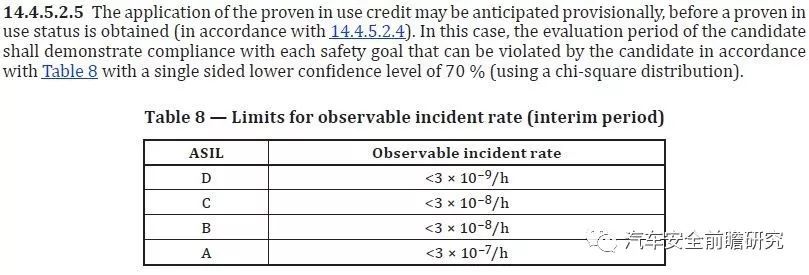
First, we can see that the improved Tier01lamda(5year) can meet the FIG7, but only Tier01 improved user operation manualsthe lamd(3year, better manual) can the proven in use can be go down.
Tier02 made first decision: To modify the Tier01'suser operation manuals, to downsizing lamd(3year) into lamd(3year, bettermanual)=2.744FIT
Second: when checking with FIG6, we have followingrational assumptions and conclusions:
The Largest OEM will sell out 10000000 annually autonomous driving cars after 2025, each car require 8 77G mm Radar, and one forth of the 77G mmRadar will come from Tier01, that means, Tier01 will produce 20000000 annually
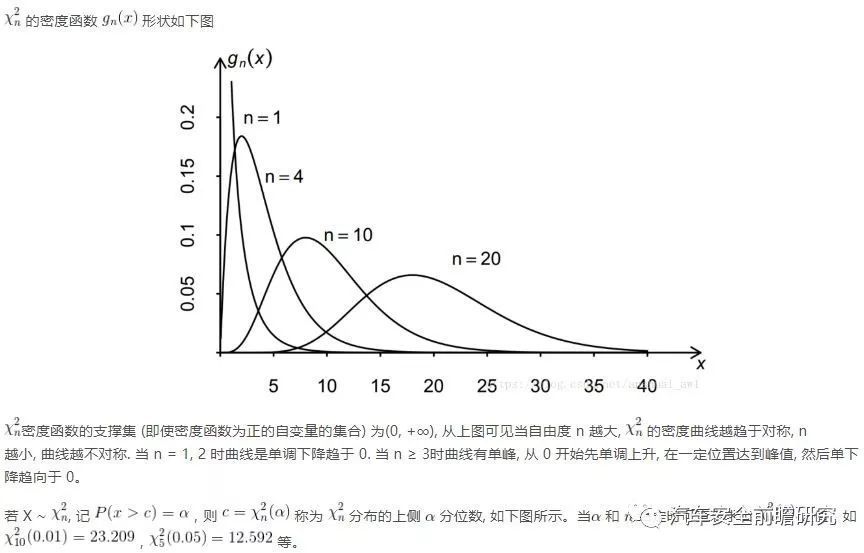
we using the chi-square distribution,chi-square properties listed as following
FIG8: chi-square distribution
And we can see the final calculations from FIG9 andFIG10:
FIG9: chi-square calculation process
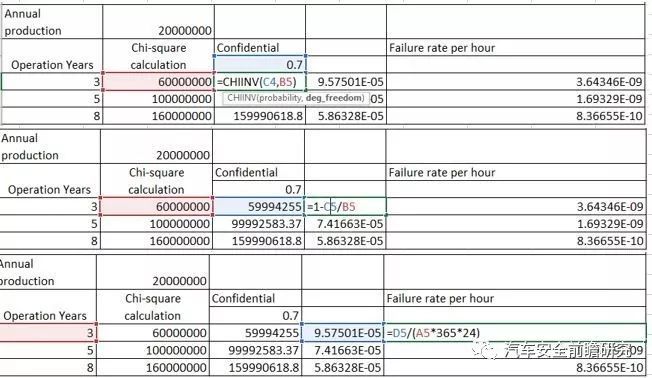
FIG10: calculation conclusion:
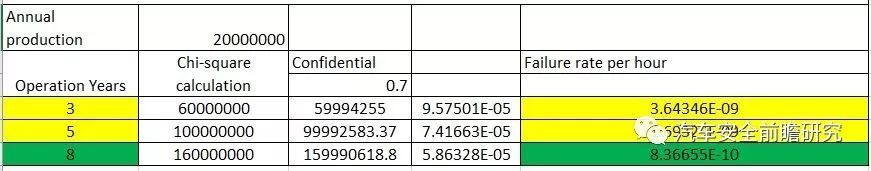
From FIG10, we can see that in the 3year and 5year, it cannot meet the requirements of Table7, 8 year can meet Table7 but 8year failure rate cannot be used due to aging effects.
And it means the Tier02 cannot directly use theTier01's 77mm Radar into proven in use in ASIL D level.
But Tier02 can directly use the Tier01's 77mm Radar into proven in use in ASIL C level, due to it is meeting the ASIL C level target failure rate in Table7.
Final conclusions for proven in use analysis:
Under Tier01 20000000 annually productions in 77G mm Radars,Tier02 cannot directly use this to fulfill into ASIL D level safety goals accomplishment, or else it will violate the Table7 regulated in ISO 26262-2018, Chapter 8
But Tier02 can use this into ASIL C level safety goals accomplishment.
Thanks for your attentions, and happy everyday.
- 用户评论